
Terrain Map
Terrain maps show the shape of the land: where it rises into ridges and falls into valleys. This generator creates a random landscape in your browser — coloured by height, shaded as if lit from the north-west, and traced with contour lines — so you can make maps for tabletop games and stories or practise reading contours. The guide below explains how real terrain and topographic maps work.
- Free to use
- No sign-up
- Runs in your browser
Terrain map generator
Map-Making Paper Pack
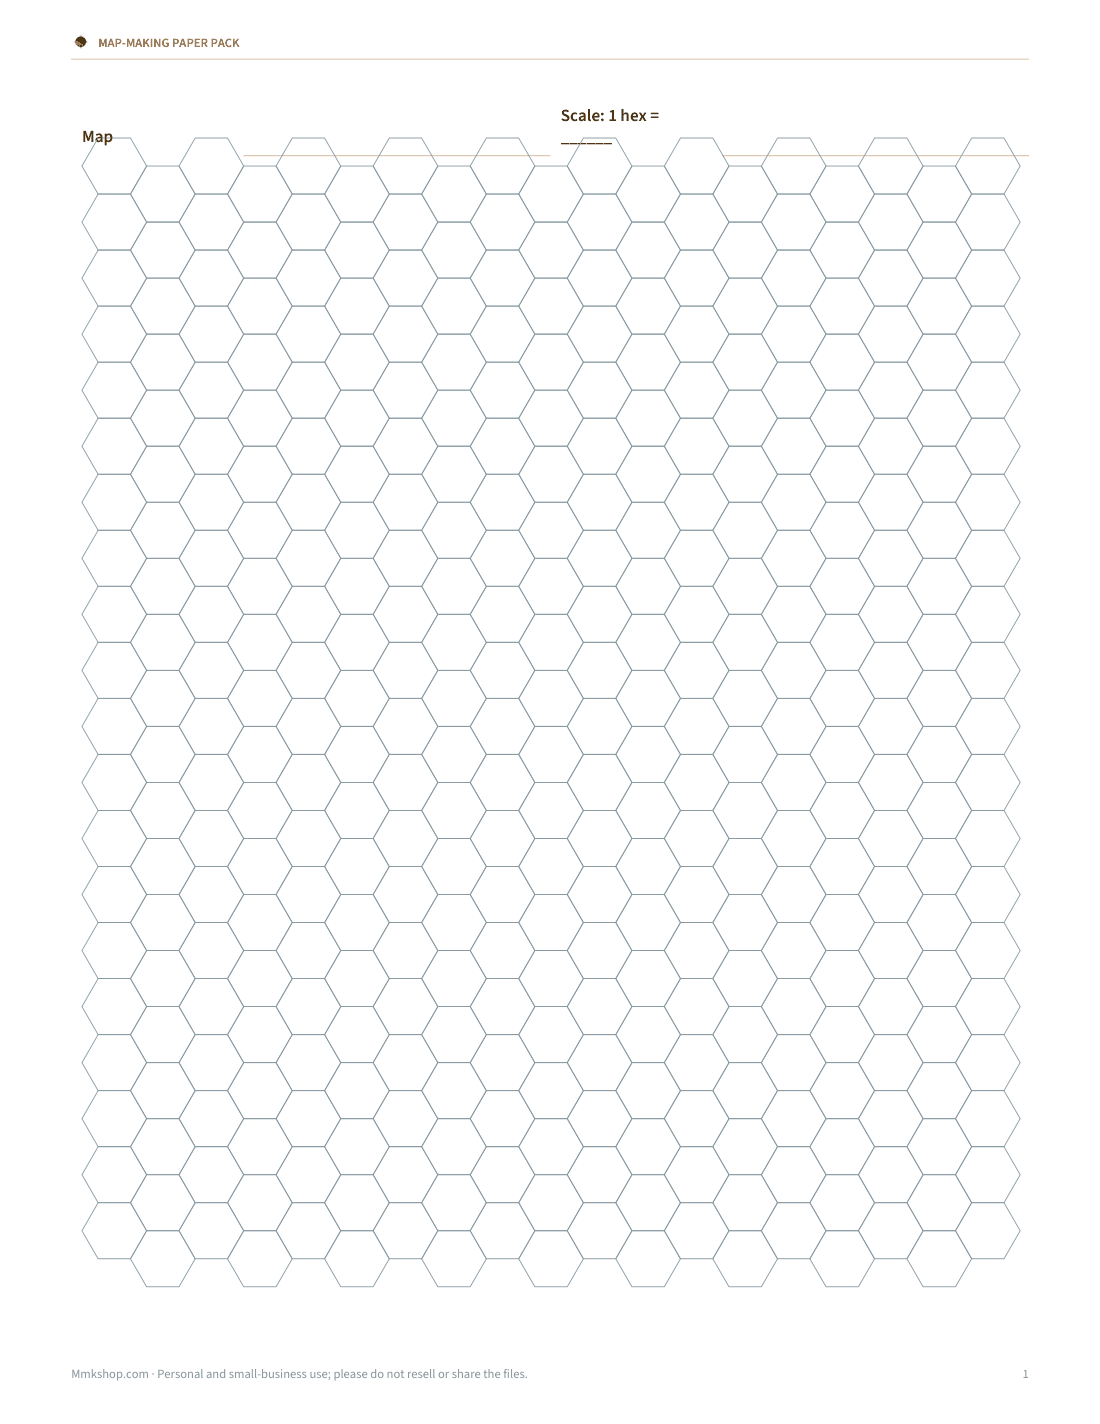
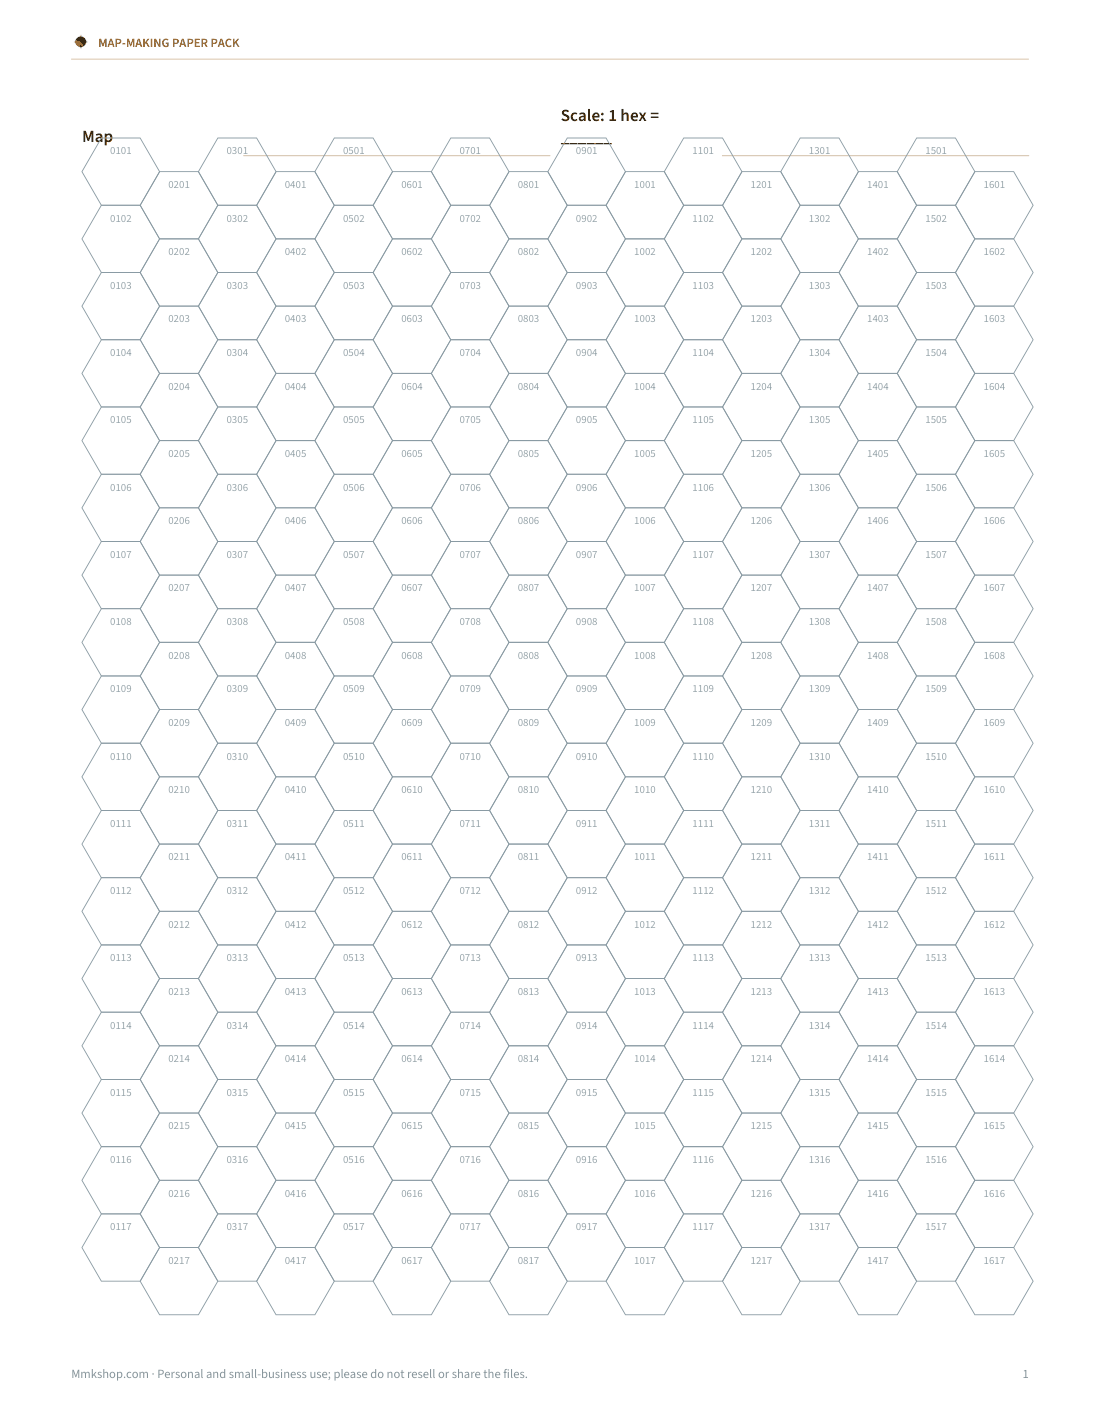
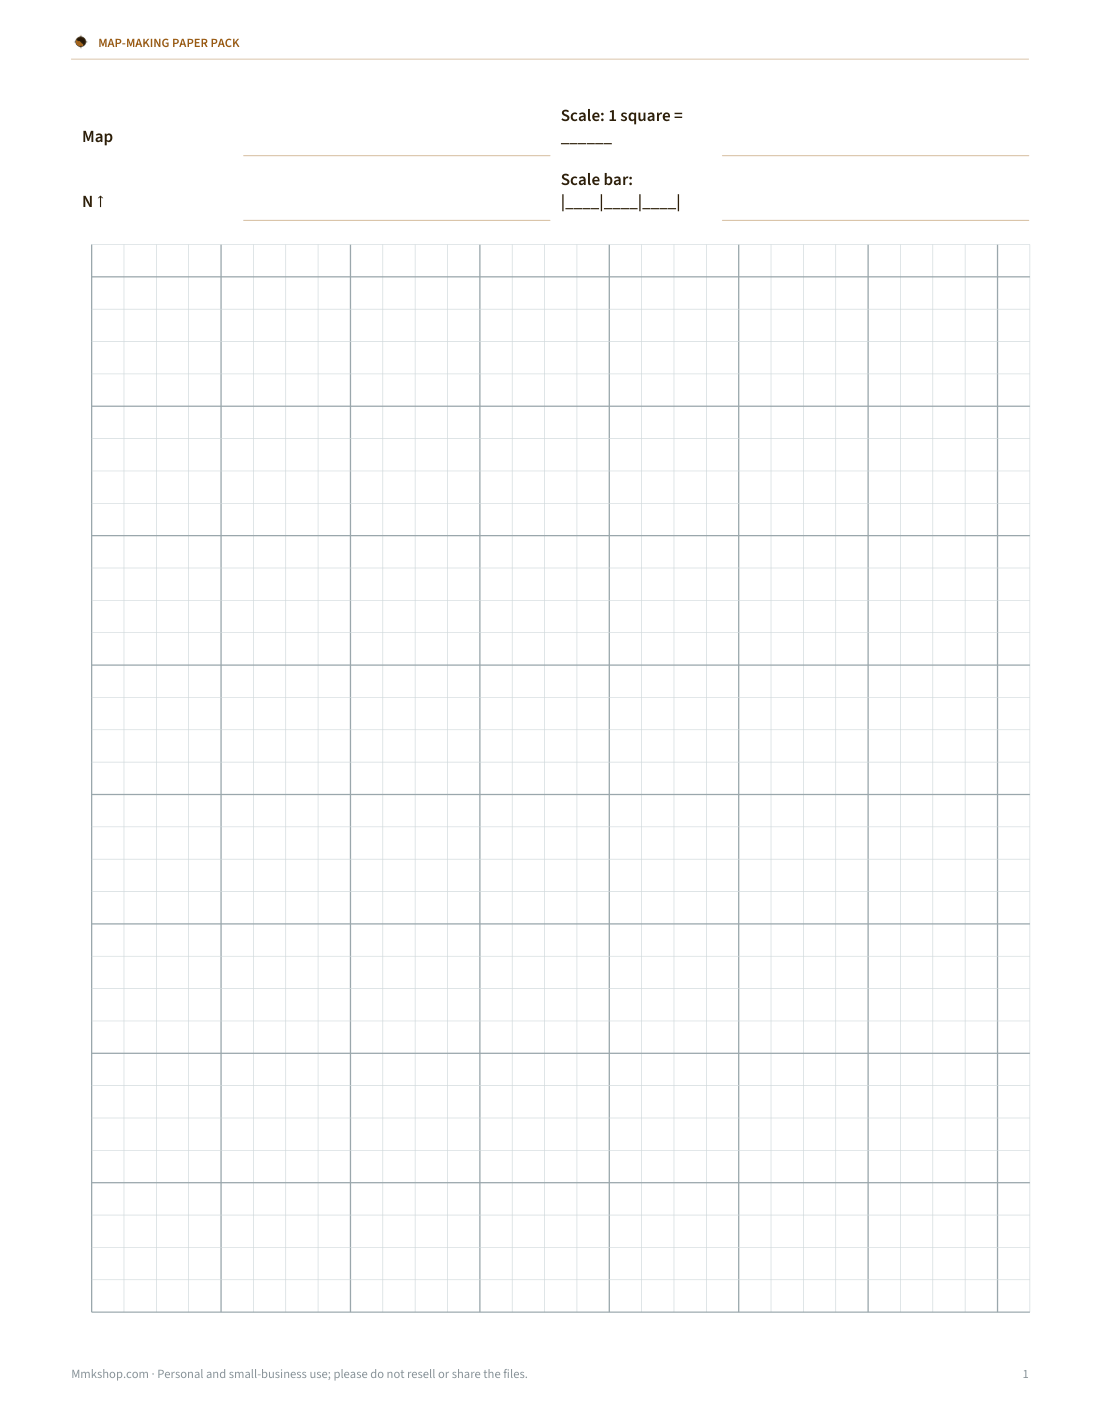
Printable hex grid paper (plain and numbered), square grid paper with compass rose and scale bar, a map legend template and a region worldbuilding sheet.
- Hex paper (PDF)
- Numbered hex paper (PDF)
- Square grid (PDF)
- Legend template (PDF/DOCX)
- Region sheet (DOCX/PDF)
Formats: PDF, DOCX. Instant download after payment (link valid 72 hours, up to 5 downloads). AI-assisted: the templates were drafted with AI help and reviewed and laid out before publishing.
$5.00 USD, one-time 5 files · about $1.00 each
- Instant download
- 7-day refund
- Secure checkout by Stripe
7-day money-back guarantee. Full refund within 7 days of purchase, even after you download.
Free sample: Hex Grid Paper (PDF, 47 KB)
Full refund within 7 days — see the refund policy and license.
Free printables
Single sheets you can print right now, no sign-up. The full pack adds every sheet in one download plus the editable files.
 Printable Hex Paper PDF
 Printable Numbered Hex Paper
 Printable Square Grid Map Sheet
 Printable Map Legend Template
 Printable Region Sheet
What a terrain map shows
A terrain map shows relief — the ups and downs of the land. It usually combines three techniques: hypsometric tints (colours that change with elevation, typically greens for lowlands through browns to white for high peaks), hillshading (shadows calculated as if the sun were shining from the north-west, so slopes look three-dimensional), and contour lines (lines joining points of equal height). Online maps with a “terrain” layer and printed topographic maps use the same ideas.
How to read contour lines
| Pattern | What it means |
|---|---|
| Lines close together | Steep slope |
| Lines far apart | Gentle slope or flat ground |
| Closed rings getting smaller | A hill or summit (the smallest ring is the top) |
| V shapes pointing uphill | A valley or stream (the V points upstream) |
| V or U shapes pointing downhill | A ridge or spur |
| An hourglass between two rings | A saddle or pass between two hills |
| Bold (index) lines | Every fifth contour, labelled with its height |
Contour interval
The contour interval is the height difference between neighbouring lines, printed in the map’s legend. Detailed hiking maps often use 5, 10 or 20 metres (or 10, 20 or 40 feet); maps of large mountainous areas may use 50 or 100 metres. To find the height of a point, count the lines up from a labelled index contour and multiply by the interval.
Using the generator
- Type a seed number or click “New random map” — the same seed always makes the same landscape.
- Move Sea level to flood or drain the land.
- Increase Ruggedness for more detailed, rougher terrain.
- Choose a contour interval and a style: colour, greyscale, parchment for fantasy maps, or a clean topo style for practising contour reading.
- Download a PNG or print it.
Worked example: reading height from contours
On a map with a 100 m contour interval and bold index contours every 500 m, you find a hilltop inside the third thin line above the 500 m index contour. Its height is at least 500 + 3 × 100 = 800 m and less than 900 m, because it is inside the 800 m line but no 900 m line appears. If the lines on the east side are three times closer together than on the west, the east face is roughly three times as steep.
Common terrain features
| Feature | How it looks on contours |
|---|---|
| Summit | A small closed ring, often marked with a spot height |
| Ridge | A line of high ground; contours form U or V shapes pointing downhill |
| Valley | Contours form V shapes pointing uphill, often with a stream |
| Saddle | A low point between two summits, shaped like an hourglass |
| Cliff | Contours merge or are drawn with a cliff symbol |
| Depression | A closed ring with small tick marks pointing inward |
| Plateau | A wide flat area inside a ring, with steep sides |
Slope and gradient
Gradient is the rise divided by the horizontal distance. If contours at a 20 m interval are 100 m apart on the ground, the slope rises 20 m over 100 m: a gradient of 20%, or about 11 degrees. Walkers find slopes above about 25% hard work; the same contour spacing on a 5 m interval map is only 5%.
Where to find real terrain maps
- National mapping agencies publish topographic maps: for example the US Geological Survey (USGS) topo maps, Ordnance Survey in Great Britain and similar agencies in most countries.
- Online map services offer a terrain or relief layer; switch it on in the layers menu.
- Open, community-made topographic maps based on OpenStreetMap data are available for many regions.
- Outdoor and hiking apps often combine contours, trails and shading for offline use.
Maps for games and stories
- Start with the coastline, then decide where the mountains are — rivers flow from high ground to the sea and never split going downstream.
- Put towns near rivers, coasts and passes; roads follow valleys and cross ridges at saddles.
- Use contours sparingly on game maps; hillshade and a few ridge lines read better at a glance.
- Print the map and add names, roads and borders by hand, or trace it onto hex paper from the pack.
Privacy
The map is generated in your browser from the seed number; nothing is downloaded from or uploaded to a server.
Map-making pack
The optional pack includes printable hex grid paper (numbered and plain), square grid paper with a compass rose and scale bar, a map legend template and a region worldbuilding sheet. The generator above is free to use.
AI-assisted content
This page was drafted with AI assistance and reviewed before publishing. Generated maps are fictional and not for navigation.
Frequently asked questions
What is a terrain map?
A map that shows the shape of the land using colours, shading and contour lines.
What do close contour lines mean?
A steep slope.
What is a contour interval?
The height difference between neighbouring contour lines.
What is hillshading?
Shading calculated as if the land were lit from one direction, usually the north-west.
Can I use the generated maps in my game?
Yes, the maps you generate are yours to use.
Are these real places?
No, they are random landscapes created from a seed number.
Why is hillshading lit from the north-west?
It is a long-standing cartographic convention that makes hills look raised rather than sunken to most viewers.
How do I find the height of a point between contours?
Estimate it: a point halfway between the 300 m and 400 m lines is about 350 m.
What is a spot height?
A point on a map marked with its exact elevation, often on a summit or road junction.